Saturday, October 6, 2012

Appsterdam Bootcamp

If you want to make movies, go to Hollywood.
If you want to make musicals, go to Broadway.
If you want to make apps, go to Appsterdam.
Mike Lee Mayor and founder of Appsterdam

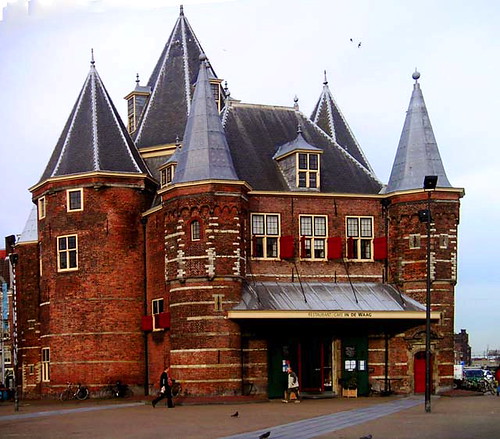
 Appsterdam Bootcamp was a great event. For those of you who do not know when that was, it was on the 28th of September. Why was it great you're wondering? (Hope that's not a rhetorical question). It was great because there were a lot of people from many places around this big world, some were designers, some programmers some students and some teachers. Basically a lot of interesting minds together all under the roof of de Waag, and what a roof that was!

Visualization for public access and policy making - Elizabeth Turner

This was the first presentation of the day. It was really interesting to hear what Elizabeth Turner had to say about this topic.
Apparently, the owners of this are:

  • UK department of health
  • Www foundation
  • Www. Iconomical.com/company/projects

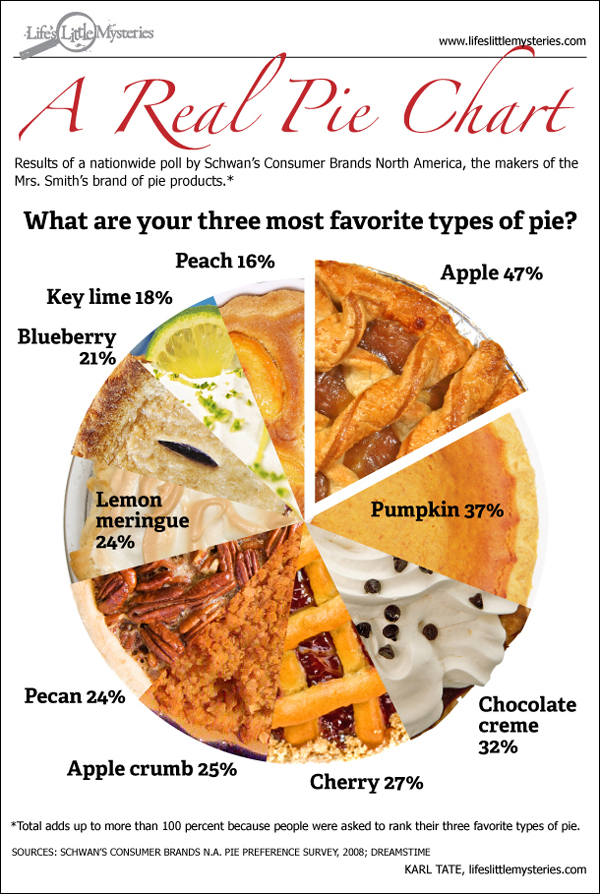
There are many things I got to learn during the presentation. Things like how 'data speaks for itself 'so there is no need to add anything other then the visualization. And the fact that in order to design a good DV the 'visualization must be simple' otherwise the designer risks sort of clogging the view of the viewer. Then again we are so used to DV that we do not even notice anymore how often we use it on a daily basis.

A great example of where DV is being used (probably made by the company where Ms. Turner works) is Plings.net or Plingorama. It looks like a great website meant for people of all ages and it contains information nicely visualized about things to do in the UK. The nice thing to note about this website is that the layers of information are organized in different ways and that is the basis of the interface for the DV.
Data items are the building blocks of the interface. The role of the interface is basically to lead the users through the data - the more simple it is the more intuitive. The essential thing for an interface is to have some options, enough to support the data, but not so much as to confuse the user. There needs to be a balance between simplicity and complexity.


Another great example was the website for Open spending in East Africa. Vizualizing budgets from African countries.This website is supported by NGO's and the point of it is to promote change through civil society.


Open Data Kenya project is a Budget explorer.It's Dashbord is complex, it is all about spending in developing countries. One hardship for designing a proper visualization for the budget explorer is the fact that classifications arent consistent.
To properly visualize different yet massive amounts of data, different chart types have been made for different types of data. Ex: how spending is distributed around the country. This allows the data to become explorable and discoverable.

When dealing with large amounts of data it is essential to filter the data: what data can you use or throw away but let the user decide what they want to see.
The website is powerful to use but harder to understand due to the many choices and different types of information.


Lex Slagerhuis in: Hackdeoverheid.nl

The next presentation was that of Lex Slagerhuis about Hackdeoverheid. The principle behind Hackdeoverheid is to have financial transparancy in the Netherlands in order to see what the budget is and how it is being spent with other words in order to have open spending.
The technical aspects would include 1 Api for all the governments, a superdatabase. This would allow citizens of this country to visualize the spending of the government.

Why would anyone want to do this and for whom?
At this part the presentation took an interesting turn. At first people were used to the idea of just watching/hearing the presentation. But then all of a sudden people became more active. Someone mentioned that for instance this would be interesting for during elections. That citizens have the right to see on whom they are voting and what that political party is using the budget for. Is a political party as good as they claim their word is? Transparency is good.
Another example was the case of fraud - think of preventing fraud bills.
It would also be useful for journalists to give clear data on which to base journals. Someone did mention that this would make for a "flatter world" a world in which so many people would ask for accountability that the government couldn't take any more steps.

Of course there were many more answers but people were talking too fast and it became hard to make notes at a certain moment.


Basically the day was very inspiring. I have learned from qualified and experienced people what intelligent ways there are for visualizing data and for creating these visualizations. I also feel that with the examples they provided I can myself better handle the tasks that the project this semester brings.


Data Visualizatie Verkenning


Authors: Mario Boot& Roxana Craciun

Wat is datavisualisatie?


      Datavisualisatie (DV) is letterlijk het visueel weergeven van quantitatieve
informatie. Een synoniem is bijvoorbeeld gegevensweergave. DV gaat over
het representeren van data. Informatie, cijfers, gegevens of andersoortige data
wordt in verhalende vorm aan de gebruiker gepresenteerd. Dit vakgebied is interdiscipline tussen grafische vormgeving, informatica en kennistheorie.
Essentieel voor datavisualisatie is het visualisatieprocess. Het visualisatieproces vertaalt gegevens naar grafische objecten - denk aan tabellen, kaarten of grafieken. Net zoals het vertalen van de ene naar de andere taal, het vertalen van ruwe gegevens op visuele obiecten betekent dat de informatie eerst gefiltreerd en getransformeerd moeten woorden.


Zowel een tabel met getallen als een grafiek van de getallen uit die tabel, zijn
vormen van datavisualisatie. Elk van die twee vormen hebben allebei hun eigen
voor en nadelen: de precieze waardes zijn in de tabel vele malen makkelijker af
te lezen, maar een geleidelijke verandering is in de grafiek beter op te merken.
Een groot voordeel van DV boven statische tekst, is dat onze hersenen geneigd
zijn om naar

Dat is precies waar bij datavisualisatie gewoonlijks op aangestuurd wordt: om
het verhaal dat de data kan vertellen, op een efficiente en visueel aantrekkelijke
manier aan de lezer te presenteren.


Praktisch nut in het dagelijks leven


In het alledaagse leven is DV al veel meer aanwezig dan sommigen wellicht
denken. Wie leert er immers niet al in de eerste levensjaren klokkijken? Door
middel van visuele elementen (rondje, streepjes) wordt data (tijd: uren, minuten)
weergegeven. Zelfs zonder de cijfers die de uren aanduiden, kan iemand nog

steeds bij benadering de tijd weten.


Grote hoeveelheden cijfers worden eenvoudig in of modellen geplaatst. De
website buienradar.nl geeft eigenlijk niets meer dan een grote set aan getallen
die een luchtdruk en dergelijke weergeven.
Op weeronline.nl is een mooi grafiekje met de temperatuur van de komende
week te vinden. In verdiepingsartikelen in kwaliteitskranten zijn modellen te
vinden die trends aanduiden op het gebied van bijvoorbeeld bevolking of
financien.
Zo zijn er nog talloze voorbeelden te bedenken waarin DV van groot nut zou
kunnen zijn. Denk eens aan de uitslagen van de verkiezingen hier in Nederland
of in America. Of de duimdikke financiele jaarraporten die instellingen als de
HvA produceren. Of de prijslijst op de menukaart in een restaurant. Of.. of..

Concrete ideeen om DV op toe te passen


DV is een Een paar concrete ideen waar DV toegepast kan zijn:

www.waarneming.nl: Met DV kunnen er cijfers over vogels gezien
woorden. Waar ze naartoe gaan en waneer en hoeveel vogels er nog
zijn.
financieel jaarrapport HvA: DV wordt waarschijnlijk al gebruikt hiervoor.
www.unity.nl: prevalentiecijfers drugsgebruik: on te kijken welke
drugs, waar, hoeveel, wie gebruikt de drugs. En hulpvolle tool voor
drugspreventie.
www.piratenpartij.nl: DV koppelen aan liquid democracy systeem
www.kijkonderzoek.nl: kijkcijfers nederlandse tv-programma's
vertrektijden & dienstregeling GVB

Bad DV

Data misbruik

Informatie is kennis. Maar wat gebeurt er als informatie misbruikt wordt?
Een voorbeeld van informatie misbruik via DV is het grafiek van Ancel Keys het vader van de low-fat
dogma. Hij had informatie verzameld over het gezondheid van 22 landen en het correlatie tussen vetten en hartvatziekten. Zijn theorie was dat vet = hartvatziekte. Misschien door frustratie dat de data die hij had verzameld geen duidelijke correlatie had tussen de twee, heeft hij alleen maar zeven landen eruit gepickt (cherrypicking data) waaruit zijn theorie wel geconfirmed was.

Onduidelijke visualizatie

Een andere vorm van BAD DV is onduidelijkheid. Als een designer te veel data heeft hij/zij loopt de risico dat de visualizatie zo onduidelijk is dat er kunnen geen conclusies meer getrokken woorden.
Bijvoorbeeld de Real Pie Chart. Mensen hebben hiervoor 2 zelfs 3 pies gestemd. De pie is gewoon onduidelijk.

Nothingness

Soms kunnen mensen zo verliefd zijn op een idee, een design van DV en toch zegt dat visualizatie niks. DV is goed om informatie te geven, om iets te communiceren. Maar wat als de DV is gewoon niks?
In deze voorbeeld kunnen we een vergelijking zien tussen Sotheby's vs. Christies markt. En de loop van de tijd. Verder niks. Absoluut niks.